Kig i bogen

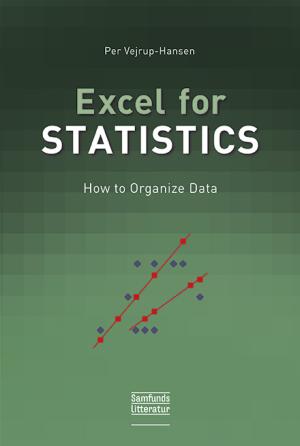
Excel for Statistics

How to Organize Data

This booklet is a handbook on statistical software, not on statistical theory and methodology as such.

The focus is on how to create input for Excel s statistical functions and data analyses when using raw data. The need for organizing data applies to survey data in particular. Also,a presentation of basic Excel targeted at statistics is included.

Prior experience with Excel is not presupposed. In conclusion, output by Excel s statistical functions and data analyses is briefly interpreted.



Køb bogen

  • Bog (Softcover)
    1. edition (2013), 100 pages
    ISBN: 9788759317891
    Studiepris
    44,-
    Buy this product
  • E-bog (Vitalsource bookshelf)
    1. edition (2013), 100 pages
    ISBN: 9788759323175
    Studiepris
    84,-
    Buy this product

Supplerende materialer

Indholdsfortegnelse

NB: For en mere udførlig indholdsfortegnelse, vælg 'Kig i bogen' herover.


Chapter 1.

Basic Excel for Statistics        7

Chapter 2

Descriptive Statistics: Looking at the Data        29

Chapter 3.

Significance Tests about Means          37

Chapter 4.

Significance Tests about Proportions          63


Chapter 5.

Testing Categorical Variables for Independence (÷2-test) .
Computing expected Frequencies         69

Chapter 6.

Correlation Analysis         73

Chapter 7.

Regression Analysis with Two Variables           75

Chapter 8.

Multiple Regression Analysis with a Categorical Variable        89

Exhibit.

Functions and Data Analyses applied . Excel 2010/2007          97

Index        100

Pensumeksemplar

Som underviser har du mulighed for at anmode om et pensumeksemplar af denne titel

Har du spørgsmål?

Du er altid velkommen til at kontakte os på info@samfundslitteratur.dk eller på telefon: 44 22 38 80.

Læs om vores persondatapolitik

Kontakt fagredaktøren

Har du en idé til en lærebog, eller mangler der en bog inden for dit fag, hører vi gerne fra dig!

Fagredaktøren er Henrik Scherning